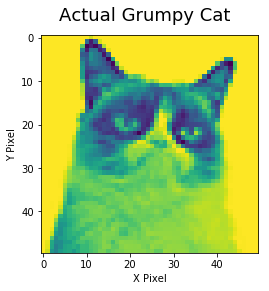
Cat Scans
For our inverse problems course, we are working on 2-D tomography.
To the programming layman (which I consider myself mostly also to be), this is an attempt to simulate the same process occurring in a CT-scan or X-ray machine. You have an unknown object, surrounded by a user-defined number of transmitters and sensors. The transmitters shoot out some probe along one line (x-rays, for instance), the receiver collects whatever passes through the object in the center. If you do this enough times, you can combine your lines to estimate the object inside.
And, of course, I couldn't resist a good cat pun.
I wrote a code that gives a graphical representation of the transmitter/sensor setup, with red dots representing the transmitters, and blue dots representing receivers. Beside them are two different mathematical approximations of the object inside, using a Least Squares (LS) method and an A Priori (MAP) method.
First was a very sparse setup, with only 9 transmitters with 5 beams/sensors:
Next, let's inch our way up, with different scenarios to see the "interference" patterns, and how they affect our estimates. The following is with 10 transmitters, each with 50 receivers:
Now, how about a more even distribution of transmitters and receivers? 30 transmitters, each with 30 receivers:
The above examples show that keeping the number of receivers and transmitters roughly equal is probably the best way to image your cat. So let's bump up the number, with 50 transmitters and 50 receivers:
At what point does the Least Squares estimate actually start to produce results? Let's keep going higher, now with 60 transmitters and 60 receivers:
To the programming layman (which I consider myself mostly also to be), this is an attempt to simulate the same process occurring in a CT-scan or X-ray machine. You have an unknown object, surrounded by a user-defined number of transmitters and sensors. The transmitters shoot out some probe along one line (x-rays, for instance), the receiver collects whatever passes through the object in the center. If you do this enough times, you can combine your lines to estimate the object inside.
And, of course, I couldn't resist a good cat pun.
I wrote a code that gives a graphical representation of the transmitter/sensor setup, with red dots representing the transmitters, and blue dots representing receivers. Beside them are two different mathematical approximations of the object inside, using a Least Squares (LS) method and an A Priori (MAP) method.
First was a very sparse setup, with only 9 transmitters with 5 beams/sensors:
Clearly underestimated! Thought geometrically aesthetically pleasing.
Next, let's inch our way up, with different scenarios to see the "interference" patterns, and how they affect our estimates. The following is with 10 transmitters, each with 50 receivers:
The LS estimate can't make heads nor tails of our kitty. The MAP estimate starts to approximate the original, though was dubbed by a colleague as "Cthulhu Cat."
Now, how about a more even distribution of transmitters and receivers? 30 transmitters, each with 30 receivers:
The LS estimate still struggles. There is a slight "ripple" pattern in the MAP estimate, but it's more or less homogeneously bad.
We tried many receivers for few transmitters, how about the other way around? The next image is with 50 transmitters, each with only 10 receivers:
LS is at least beginning to have postitive values, but still nothing concrete. In a setup like this, we can see a really strong "ripple" interference pattern in the MAP estimate.
The above examples show that keeping the number of receivers and transmitters roughly equal is probably the best way to image your cat. So let's bump up the number, with 50 transmitters and 50 receivers:
LS is starting to dream about cats. For the MAP... success!! Though still a bit underestimated.
At what point does the Least Squares estimate actually start to produce results? Let's keep going higher, now with 60 transmitters and 60 receivers:
At last, a successful Cat Scan! Now, with enough information, we can see that the LS estimate produces a cleaner result than the MAP estimate.


nice
ReplyDelete