Markov random field removal of stars and interference from auroral images
ALIS imager in the ALIS-mobile. The ALIS mobile is an old French made van with a bunch of computers and scientific hardware in the back -- exactly like one would expect a spy van from a 80s era cop movie to look like. The imager used a 6300 Å narrow band filter that is sensitive to emissions from energized atomic oxygen.
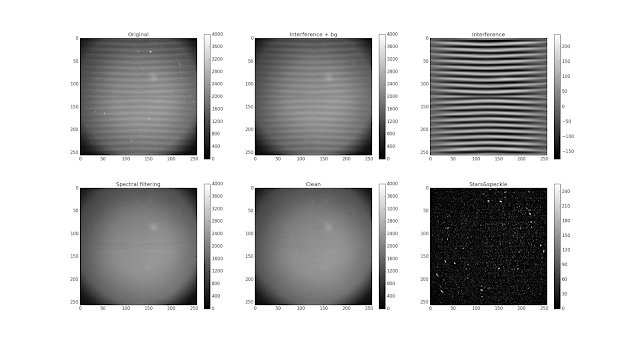
The campaign was successful in producing artificial aurora, but unfortunately interference from the CRT display leaked into the images. The airglow can be seen even in the noisy data, but it would be nice to remove the interference. Björn has been looking at removing this interference and I thought I'd give a helping hand.
Each horizontal streak in the optical image is due to a scan of the CRT display signal induced into the imager signal. Björn tells me that they used an unprotected ribbon cable wrapped around the CRT display for maximum stability of the imager, but at the same time, maximized the mutual coupling of the cable carrying the imager signal and the CRT display. The problem was already identified at the time of observations, but nothing could be done. You could either observe blind, or accept interference and be able to keep eye on the imager output during measurements.
Image processing seems like fun, so I thought I'd give it a stab. After some trial and error, some espresso and some talking with Björn, some code got written up. It seems to work reasonably well.
The first step involves removing the stars and hot pixels. This is done by using iterative renormalized least-squares and a Laplacian prior (second order Tikhonov). The next step is to isolate the horizontally correlated spectrally narrow interference. Finally, the interference, stars, and hot pixels are subtracted from the original image, leaving only the real airglow within the image.
As we're in the middle of an inverse problems course, this turns out to be a useful demonstration of for applications of sparse matrices, Tikhonov regularization, and iterative renormalization.
The method here is also useful just for separating stars and hot pixels from from airglow in auroral images. Having a separate image with just the stars also is helpful when doing a star calibration.
Here's the Python code, in case you're interested.
#!/usr/bin/env python
import numpy as n
import matplotlib.pyplot as plt
from scipy.sparse import coo_matrix
import scipy.sparse.linalg as s
import scipy.io as sio

# load auroral image
a=sio.loadmat("img24JV.mat")
I=a["Dtmp"]

# theory matrix with individual weights for each pixel
def create_theory_matrix(I,sigma,alpha_x=0.1,alpha_y=0.1):
    n_x=I.shape[0]
    n_y=I.shape[1]
    n_pa=n_x*n_y
    row_idx=0

    rows = []
    cols = []
    data = []
    d = []

    # measurements
    for i in range(n_x):
        for j in range(n_x):
            rows.append(row_idx)
            cols.append(i*n_y + j)
            data.append(1.0/sigma[i,j])
            d.append(I[i,j]/sigma[i,j])
            row_idx+=1

    # laplacian regularization
    for i in range(1,n_x-1):
        for j in range(1,n_y-1):
            rows.append(row_idx)
            cols.append(i*n_y + j-1)
            data.append(alpha_x)

            rows.append(row_idx)
            cols.append(i*n_y + j)
            data.append(-2.0*alpha_x)

            rows.append(row_idx)
            cols.append(i*n_y + j+1)
            data.append(alpha_x)
            d.append(0.0)
            row_idx += 1

            rows.append(row_idx)
            cols.append((i-1)*n_y + j)
            data.append(alpha_y)

            rows.append(row_idx)
            cols.append(i*n_y + j)
            data.append(-2.0*alpha_y)

            rows.append(row_idx)
            cols.append((i+1)*n_y + j)
            data.append(alpha_y)
            d.append(0.0)
            row_idx += 1

    n_row=row_idx
    n_col=n_x*n_y
    # create a sparse theory matrix
    G=coo_matrix((data, (rows, cols)), shape=(n_row, n_col), dtype=n.float32)
    # return matrix and measurement
    return(G,d)

n_x=I.shape[0]
n_y=I.shape[1]
sigma=n.zeros([n_x,n_y])

# iterative renormalized least-squares
sigma[:,:]=1.0
for i in range(5):
    G,d=create_theory_matrix(I,sigma,alpha_x=5.0,alpha_y=1.0)
    i0=s.lsqr(G,d)[0]
    i0.shape=(n_x,n_y)
    sigma=(n.abs(I-i0)+1.0)*0.01

# star-field is the residuals
stars=(I-i0)
stars[stars<0]=0
bg=i0

# estimate background (smooth in x and y)
sigma=n.zeros([n_x,n_y])
sigma[:,:]=1.0
G,d=create_theory_matrix(i0,sigma,alpha_x=40.0,alpha_y=40.0)
i0bg=s.lsqr(G,d)[0]
i0bg.shape=(n_x,n_y)

# interference (image - smooth background)
i0o=i0-i0bg

# estimate interference using markov random fields that are
# strongly horizontally correlated.
G,d=create_theory_matrix(i0o,sigma,alpha_x=200.0,alpha_y=0.2)
intf=s.lsqr(G,d)[0]
intf.shape=(n_x,n_y)

# remove inteference using spectral filtering
CI=n.copy(i0)
for i in range(2):
    for j in range(2):
        print(i,j)
        I0=i0o[(i*128):((i+1)*128),(j*128):((j+1)*128)]
        CI0=n.copy(I0)
        for ki in range(128):
            F=n.fft.rfft(I0[:,ki],1024)
            F[60:100]=0.0
            F[140:180]=0.0
            filt=n.fft.irfft(F,1024)
            CI0[:,ki]=filt[0:128]
        CI[(i*128):((i+1)*128),(j*128):((j+1)*128)]=CI0+i0bg[(i*128):((i+1)*128),(j*128):((j+1)*128)]


# plot stuff
plt.subplot(231)
plt.imshow(I,cmap="gray",vmin=0,vmax=4000)
plt.title("Original")
plt.colorbar()

plt.subplot(232)
plt.imshow(i0,cmap="gray",vmin=0,vmax=4000)
plt.title("Interference + bg")
plt.colorbar()

plt.subplot(233)
plt.imshow(intf,cmap="gray")
plt.title("Interference")
plt.colorbar()

plt.subplot(234)
plt.imshow( CI,cmap="gray",vmin=0,vmax=4000)
plt.title("Spectral filtering")
plt.colorbar()

plt.subplot(235)
plt.imshow(i0o - intf + i0bg,cmap="gray",vmin=0,vmax=4000)
plt.title("Clean")
plt.colorbar()

plt.subplot(236)
plt.imshow(stars,cmap="gray",vmin=0,vmax=256)
plt.title("Stars&speckle")
plt.colorbar()
plt.show()


Comments
Post a Comment