 |
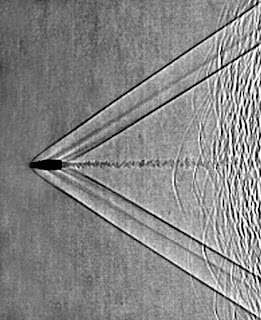
| Bow waves left behind by a bullet moving at supersonic velocity. Source: Wikipedia. |
Shunrong Zhang's paper on detection of bow waves in the Earth's ionosphere during the 2017 eclipse was published this week. The paper shows for the first time bow waves in the ionosphere measured using a dense network of over 2000 GNSS TEC receivers over continental US. The bow waves are caused by the rapidly moving Moon shadow during the 2017 US eclipse. The shadow of the Moon moves at a supersonic speed and leaves behind a bow wave, much like the waves behind a boat moving on a lake or the pressure waves created by a bullet moving at supersonic velocity.
 |
| A figure that shows the bow waves in the wake of the eclipse. The waves are very small in amplitude (about 1% fluctuations in total line integrated electron content). |
The paper received a lot of media coverage. For example,
Gizmodo,
Newsweek, and
National Geographic wrote articles about this study. I was lucky enough to be a coauthor on this paper, so much of the media coverage lists this as a collaboration between MIT and University of Tromsø!


This article presents an interesting study of bow waves created in the Earth's ionosphere during the 2017 solar eclipse. The research used a dense network of more than 2,000 GNSS TEC receivers across the continental United States to detect the small ionospheric disturbances produced by the rapidly moving Moon's shadow.
ReplyDeleteThe use of a large network of receivers and the analysis of the resulting measurements demonstrate how computational techniques can be applied to complex observational datasets. This makes Data Science Projects For Final Year relevant to the data-analysis aspects of this research.
The article's figure showing the bow waves also illustrates the importance of processing and presenting scientific measurement data visually. Similar concepts can be explored through Ieee Image Processing Project Titles, particularly when working with scientific images and measured data.
ReplyDeleteThe study is also an interesting example of how programming can support scientific data processing, especially when observations from many receivers need to be analyzed systematically. A Python Online Course can provide the programming foundation needed for working with numerical data and developing analytical applications.
ReplyDeleteThe visualization of very small ionospheric variations demonstrates how appropriate plotting techniques can make scientific patterns easier to examine. For learners interested in developing these capabilities with Python, Matplotlib Course is relevant to the visualization side of data analysis.
ReplyDelete